Benchmarks & Performance
Query Benchmarking
GraphQL ASP.NET is designed to be fast. For our benchmarks, we are tracking a number of query types which measure performance via the various paths through the library; multi controller queries, queries with variables etc. These are executed against an in-memory data store without an attached database.
The goal of our benchmarks is to measure the library's abiliy to process a query in isolation, to perform the query and execute user code; not how long an action method takes to query a database for data and send a request over the wire. Obviously, real world workloads are going to be slower than these theoretical values, but the faster we can make the benchmarks the faster all other scenarios will be.
As you can see all query types execute in sub-millisecond timeframes. If there is a specific query type or scenario that you are seeing a significant performance degregation with please open an issue on github and let us know!
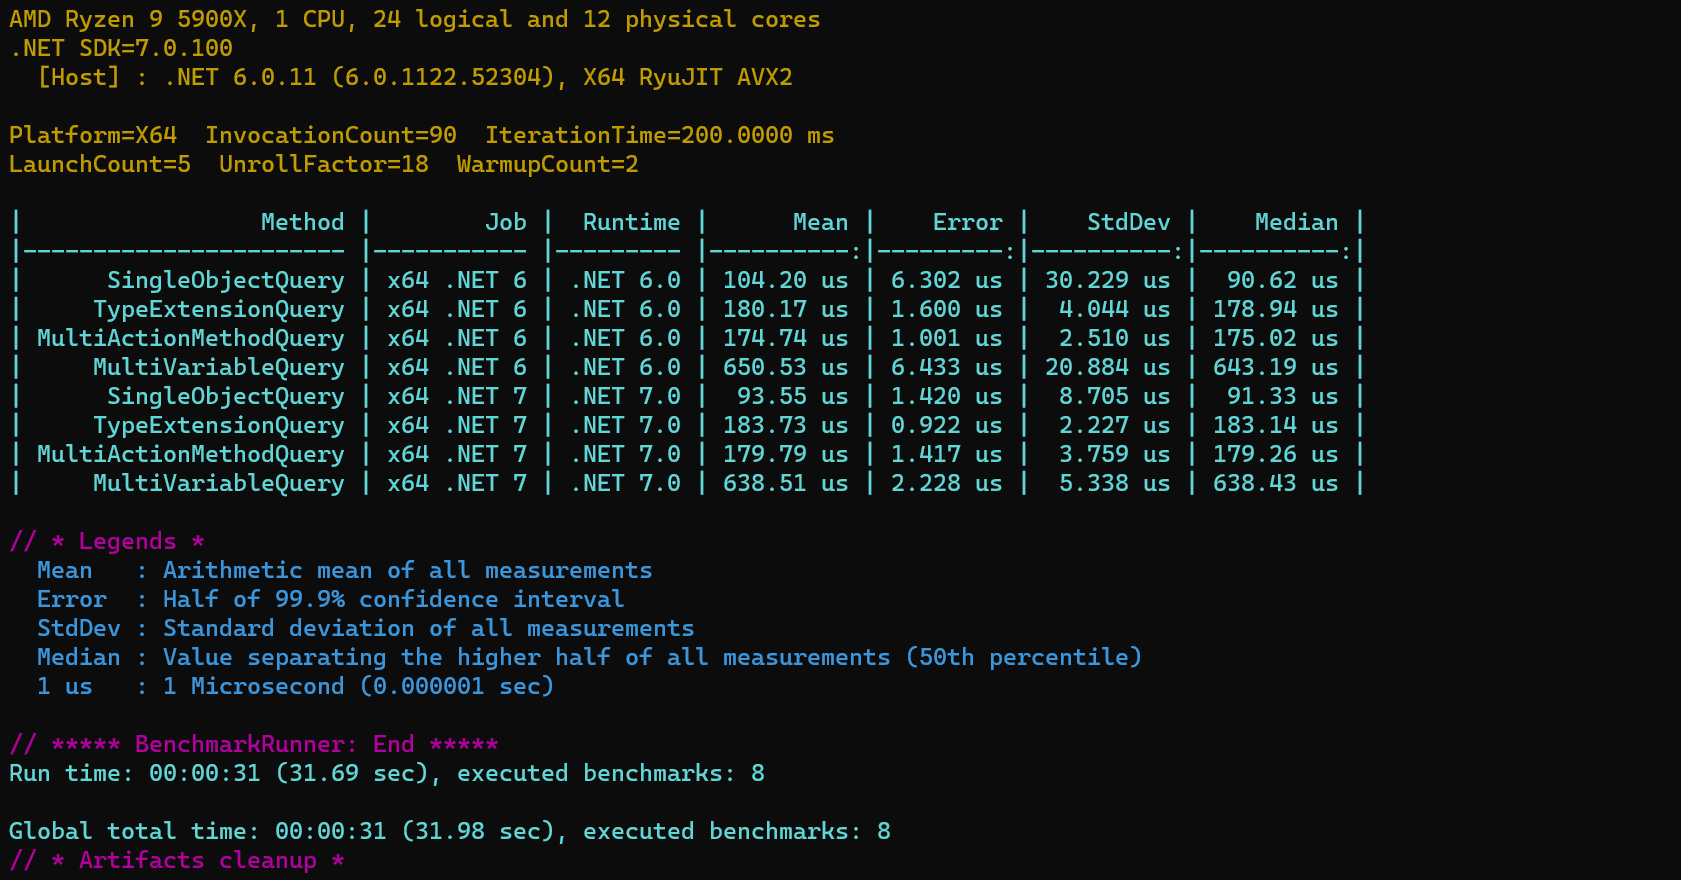 Last Updated 2022-12-01; v0.14.0-beta
Performance will vary depending on your hardware and environment conditions. You can execute your own test run via the bench marking solution located at ./src/graphql-aspnet-benchmarks.sln
Performance Testing
These performance tests are not intended to be used as data points when determining scaling requirements for your own production workloads. Your use cases will be different and effected by factors not present in our lab environment (e.g. database connections, service orchrestration, business logic etc.). Be sure to execute your own load tests using queries indicative of your expected user base and act accordingly.
We periodically execute tests against the library to measure throughput and stability, for a single server instance, under load. Our goal is to measure the theoretical limits in a multi-user, "production like" scenario.
These tests are executed in a controlled setting with the following conditions:
Test Configuration and Specs
GraphQL ASP.NET Server:
- source code:
./src/ancillary-projects/benchmarking/graphql-aspnet-load-server/ - .NET 7 Runtime
- Garbage collection executing in server mode
- Local area, wired, gigabit network
- Simple queries to fetch or mutate a single, in-memory object
Memory Profiling Load:
- JMeter script:
graphql-memory-profiling.jmx - 15 concurrent users executing a graphql query to fetch a single object
- Each user executes 10,000 requests at most 30ms apart
GraphQL Load:
- JMeter script:
graphql-load-generator.jmx - 300 concurrent users executing a graphql query to fetch a single object
- 300 concurrent users executing a graphql mutation (and raising a subscription event)
- Each user executes 10,000 requests at most 30ms apart
Subscription Client Load:
- Source Code:
~coming soon~ - A custom console app that registers subscribers to receive subscription events generated via the Load Generating Workstation mutations
- 500 connected subscription clients
- 2 registered subscription per client (1000 total client subscriptions)
REST Load:
- JMeter script:
rest-load-generator.jmx - 300 concurrent users executing a REST Query that fetches a single object
- 300 concurrent users executing a REST Query that mutates and returns a single object
- Each user executes 10,000 requests at most 15ms apart
- This workload acts as a control to compare performance of the baseline web api against the overhead of the graphql library
GraphQL Max Throughput Load:
- JMeter script:
graphql-max-load-generator.jmx - Starts 20 new users each second until failure
- Each user executes a query every 0-15ms until failure
Memory Profile Test
A qualitative test executed with the server instance running in release mode, harnessed via dotMemory. Given the artificial environment restrictions this imposes its difficult to pin down exact KPIs but in general this test is used to monitor:
| Metric | Expectations |
|---|---|
| Memory Allocation | Expect to see steady Gen0 allocation over time, with no extreme spikes. |
| Object Survival | Expect to see little to no objects surviving to Gen1 and Gen2 heap collections per GC cycle. When the test completes, the server returns to a steady state of memory usage prior to the test beginning. |
The aim of this test is to ensure acceptable memory pressure and GC cycles on the server instance in a controlled usage scenario and ensure no memory leaks occur.
Results
| Date | Version | |
|---|---|---|
| 2022-11-30 | v0.13.1-beta | Execution is consistant. While no objects make it to Gen1 or Gen2 a GC cycle occurs about every 20 seconds. |
| 2022-11-30 | v0.14.0-beta | Similar results to the v0.13.1-beta test in terms of generational memory allocations. There is a notable decrease in memory pressure. Time between GC cycles has improved to once every 33 seconds; a 65% increase in duration. |
General Usage Load Test
A test with the server executing in release mode, WITHOUT the subscription server attached and with monitoring via passive dotnet-counters. This test measures the throughput of queries and mutations through the runtime as well as the load those queries place on the server CPU. Using GraphQL (as opposed to REST) will generate some additional overhead to parse and execute the query on top of the REST request which invokes it. As a result, the metrics of this test are expressed in terms of % increases over a comperable REST workload via a baseline ASP.NET web api controller.
| Metric | Expectations |
|---|---|
| CPU Utilization | Using Process Explorer to measure utilization, no more than a 5% increase when compared to the REST control load. |
| GC % Time | Using the metrics obtained via dotnet-counters expect that the GC % time is within 1% of the REST control load |
| Throughput (req/sec) | Throughput, measured in requests per second, is within 10% of the peak load generated via the REST control load |
The aim of this test is to ensure adequate single instance throughput and that the overhead for using graphql on top of web api is kept to a minimum.
Results
| Date | Version | Metric | REST Workload | GraphQL Workload | Variance |
|---|---|---|---|---|---|
| 2022-11-30 | v0.13.1-beta | CPU Utilization | 0.01-2% | 2-9% | +7% |
| GC % Time | < 1% | 2-4% | +3% | ||
| Throughput | 37,490 req/sec | 29,830 req/sec | -8k (-20%) | ||
| 2022-12-1 | v0.14.0-beta | CPU Utilization | 0.01-2% | 1-3% | +1% |
| GC % Time | < 1% | < 1% | +0% | ||
| Throughput | 37,360 req/sec | 36,509 req/sec | -2k (-2.3%) |
Max Throughput Test
A simple test flooding the server with an ever-increasing amount of traffic until it begins to deny requests or fails completely. The throughput of each loading client is summed just prior to failure and recorded as the max throughput.
Results
| Date | Version | Metric | GraphQL Query |
|---|---|---|---|
| 2022-12-1 | v0.14.0-beta | Max Throughput | 57,919 req/sec * |
* We ran out of client machines and could not generate any more load against the test server. At the time, the server process indicated 5% CPU utilization and less than 750mb of committed memory.
Subscription Event Load Test
Coming Soon